
Cast Iron
FLOW-3D CAST‘s cast iron model describes the solidification of hypo- and hyper-eutectic iron-carbon-silicon alloys. It predicts the formation of graphite, austenite (or gamma-iron) and carbide phases during the eutectic reaction. Volume changes during cooling and solidification are coupled with shrinkage and porosity formation models. The cast iron model uses a realistic iron freezing path and a chilling susceptibility criterion that controls the local amount of carbide formation.
One of the main concerns of a foundry engineer is excessive shrinkage porosity that may form during solidification. Most of the volumetric changes in cast irons take place during cooling of the liquid alloy from the pouring temperature to the solidus and, more significantly, during eutectic solidification, when gamma-iron, graphite and carbide form. The placing of risers (or risering) provides additional metal to feed the shrinkage. Optimum risering is important for achieving good quality castings at minimum cost. The amount of shrinkage can also be controlled by proper alloying and cooling of the metal. The cast iron model in FLOW-3D CAST takes into account all these factors to predict the formation of porosity and the development of the phases during eutectic solidification.
Overview of the Cast Iron Model
Cast iron is a near-eutectic iron alloyed with carbon and silicon. Carbon is typically present in the range from 2.5 wt % to 4.5 wt % and silicon in the range from 1 wt % to 3 wt %. Silicon is added to stabilize graphite and to reduce “chilling” tendency (i.e., the formation of carbidic iron). Other elements and compounds are present in trace amounts and typically either control the graphite shape (e.g., magnesium in ductile iron), act as additional deoxidizers (e.g., phosphorous), or serve as inoculants of graphite (e.g., ferrosilicon).
FLOW-3D CAST‘s cast iron model accounts for the volume changes occurring from the pouring temperature to the solidus: shrinkage during cooling in the liquid state; further shrinkage during pre-eutectic gamma iron formation; subsequent shrinkage or expansion during the eutectic reaction; and the secondary shrinkage from the end of the eutectic reaction to the solidus. Since cast iron typically contains non-iron phases that may affect the formation of carbide, a heuristic allowance—in the form of the chilling susceptibility parameter—is made for the effect of these phases on the density of the solidified metal.
The latent heat release in the cast iron solidification model is computed as a function of temperature (the so-called freezing path) determined from the Fe-C phase diagram [1], using the concentration of carbon and silicon in the initial melt. The model can be used together with the general solidification model, with or without flow. However, volume changes associated with the formation of different phases are only coupled to the simplified shrinkage model that does not include flow.
The effect of mold wall movement during iron expansion is not included in the present model. Any net volume expansion that cannot be accommodated by the available space in the mold is ignored.
In the eutectic region, the speed of the eutectic front is used to compute the local chilling tendency, and, therefore, the local amount of carbide, so modeling chill zones near mold walls is possible. No attempt is made to track further transitions of the eutectic phases during the solid-state eutectoid transformation, that is, the final as-cast microstructure is not predicted.
For hyper-eutectic cast irons it is assumed that only graphite forms during the initial pre-eutectic stage of solidification, as in gray and ductile irons. In other words, the model does not include the solidification of hyper-eutectic white irons during the pre-eutectic stage in which primarily carbide forms.
Cast Iron Freezing Path
The cast iron freezing path is that of a eutectic alloy. It can be characterized by the liquidus temperature, eutectic temperature, the eutectic-start and eutectic-end solid fractions and the solidus temperature. All, but the last two quantities are computed from the equilibrium ternary Fe-C-Si phase diagram [1].
The carbon solubility in the gamma phase depends on the Si content, in wt %, according to:
(1) $latex \displaystyle {{C}_{{\gamma ,mx}}}=2.07-0.098Si,$
which is in close agreement with the solubility reported by Stefanescu [2]. The liquidus temperature of the alloy, in degrees centigrade, follows from either the hypo-eutectic liquidus plane:
(2) $latex \displaystyle {{T}_{i}}=1636-113\left( {C+0.25Si} \right)$
or, the hyper-eutectic liquidus plane [2]:
(3) $latex \displaystyle {{T}_{i}}=-505.8+389.1\left( {C+0.31Si} \right),$
and the eutectic compositions and temperatures are given by the intersection of these planes:
(4) $latex \displaystyle {{C}_{e}}=4.26-0.296Si,$ $latex \displaystyle {{T}_{e}}=1154.6+5.2Si$
The beginning of the eutectic reaction is a derived quantity given by the lever rule:
(5) $latex \displaystyle {{f}_{e}}=\frac{{c-{{c}_{\varepsilon }}}}{{{{c}_{{\gamma ,mx}}}-{{c}_{\varepsilon }}}}.$
The measurements in [3] suggest this approximation is adequate for a number of cast irons.
The end of graphitic eutectic reaction, fee , and the solidus Ts, are left as user-defined quantities. If one considers positive segregation of phosphorous in the liquid, the actual solidus temperature is below the graphitic eutectic temperature, and is as low as 1100 °C. For this case, it is assumed that graphite precipitation is complete before the end of freezing, and that the last fraction of metal to freeze, 1-fee, does so at a density ρei different from the eutectic density.
Density Changes
Typically, superheat in cast iron castings is large and shrinkage during cooling is significant before any solidification even begins. The temperature dependence of the liquid iron density is modeled either in a linear form:
(6) $latex \displaystyle \rho \left( T \right)={{\rho }_{0}}\left[ {1-\alpha \left( {T-{{T}_{0}}} \right)} \right]$
or by defining the function ρ(T) in a tabular form.
Once in the freezing range, gamma iron forms until fe solid fraction is reached. The density value of this phase, ρϒ, is a 7.2 g/cc [4,5,6]. Upon reaching fe solid fraction, the eutectic reaction begins during which a regular (white) eutectic and an irregular grey eutectic grow competitively. At high freezing rates and high eutectic-freezing-front speeds the white eutectic is stable in part due to shallower carbon concentration gradients ahead of the eutectic front. At lower eutectic-front speeds the grey eutectic is stable.
A simple approach is used to account for chill formation. In a range of eutectic freezing front speeds,
(7) $latex \displaystyle {{\nu }_{e}}\in \left[ {\frac{{\nu -}}{{{{X}_{{eut}}}}},\frac{{\nu +}}{{{{X}_{{eut}}}}}} \right]$
the amount of chill formed varies from zero to the maximum allowed for a given carbon composition. The parameters ν-=30 μ/ms, and ν+=60 μ/ms, and Xeut is the chilling susceptibility criterion, a user-defined parameter, with values in the range from 0.0 to 1.0 with the default of one. For well-inoculated iron, or for a grey eutectic with a high specific surface area, Xeut is close to zero, and no chill will form. On the other hand, if the iron is un-inoculated the default value of one should be more appropriate. The actual value of Xeut must be determined experimentally, for example, from an ASTM chill-wedge test (Fig 1.).
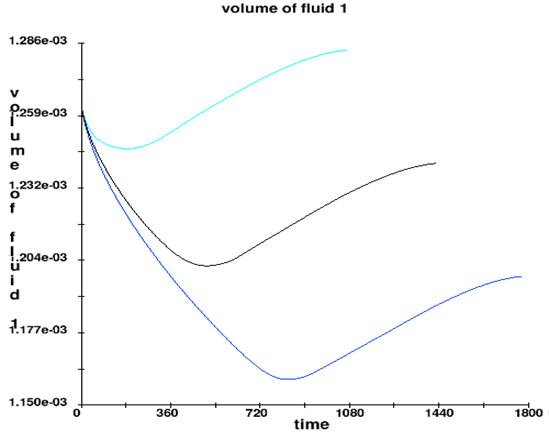
The net volume change of the casting is the combined effect of the liquid shrinkage and the amount of different phases formed during solidification. Figure 2 shows the evolution of the metal volume for three different superheat temperatures for an alloy with 3.4 wt % of carbon and 2.5 wt % of silicon. Larger superheat leads to a net reduction of the metal volume, with the expansion later during solidification due to graphite formation unable to compensate for the loss of volume.
Summary
A cast iron model is described for tracking density changes in iron during freezing and for predicting the microstructure that contains graphite, austenite and carbide phases [7]. This model is an option to the simplified solidification shrinkage and micro-porosity models. It can be used during solidification, with or without flow, to better define heats of transformation in iron with high (> 2%) carbon content. Both shrinkage and expansion are included in the model without flow, except when there is no space for expansion in which case the expansion is ignored.
References
[1] G. Goodrich and John Svoboda, “Basic Concepts of Ferrous Metallurgy,” Cast Metals Institute, Inc., American Foundry Society, Inc., 1997.
[2] D. M. Stefanescu, S. Katz, “Thermodynamic Properties of Iron-Base Alloys,” ASM Handbook Volume 15, Casting (ASM International), 2008.
[3] K.G. Upadhya, D.M. Stefanescu, K. Lieu and D.P. Yeager, “Computer-Aided Cooling Curve Analysis: Principles and Applications in Metal Casting,” AFS Transactions, Vol. 97, 1989, 61-66.
[4] AFS, “Gating Calculations for Iron Castings,” spreadsheet, 2009.
[5] Von Alfred Holzmuller, VDG and Robert Wlodawer, VDG, “Zehn Jahre Speiser-Eingrs-Verfahren fur Guseisen,” Giesserei, 1963.
[6] G. Goodrich, “Introduction to Cast Irons,” ASM Handbook, Volume 15: Casting, 2008, pp 794-795.
[7] A. Starobin, M.C. Carter, “Modeling Volume Changes and High Temperature Microstructure in Cast Iron,” Flow Science Technical Note FSI-11-TN89, 2011.
