São Roque Hydro Power Plant
This article was contributed by Matthias Haselbauer, RMD Consult and Carlos Barreira Martinez, Federal University of Minas Gerais.
In Brazil, the use of surface water has constantly increased during the past 150 years. To maintain navigability, to generate hydropower, and to defend against flooding, a large number of obstacles and diversions have been erected that interfere with natural flows. Fish and other small animals that inhabit the rivers suffer from these alterations. A massive decrease in the number of fish to the point of extinction of some species has been observed. With the simultaneous decrease in fish, bird, and mammal populations, the enormous human impact on the food chain has become obvious.
In an attempt to keep rivers open for fish, a large number of fish passages have been built in Brazil, but their efficiency in respect to both their biological and technical aspects was often poor. The flow situations in the passages, often designed using one-dimensional and empirical assumptions, result in an excessive selectivity and in poor locations. In contrast to the traditional one-dimensional design of fish passages more appropriate tools are available today. With computational fluid dynamic (CFD) simulations, not only the mean velocity field can be investigated, but also transient flow effects, which have considerable influence on the usefulness of fish passages. To achieve optimum results a coupling of hydraulic and biological considerations is essential in the design process.
In this work, turbulent coherent structures inside a periodic vertical sluice gate fish passage are discussed. Between two pools, with lengths of 4.50m and widths of 3.30 each, the flow has to pass a small vertical opening with an extension of 0.50m (Fig. 1). The CFD simulations were carried out with FLOW-3D. Our civil and environmental customers now use FLOW-3D HYDRO for these types of modeling and analysis. With periodic boundary conditions in the flow direction the achievable resolution was about 2.5cm. The level difference of the water surface Δh between the two pools was 20cm. Hence, the maximum of the absolute velocity is about 2 m/s ≈ Δh*2g. The entire potential energy is transformed into kinetic energy and later dissipated in the pool. Areas of high velocities form where jets are detached from the walls.
By means of a Large Eddy Simulation (LES), a detailed analysis of the instantaneous flow regime was possible. The distribution of velocity and turbulence fields, as well as coherent turbulent structures within the pools allowed for a better understanding of fish behavior.
Turbulent pressure fluctuations
The instantaneous velocity or pressure fields can be divided into the mean values and corresponding fluctuations. The respective equation for the fluctuating pressure is:
$latex {\tilde{p}}’=\tilde{p}-\left\langle {\tilde{p}} \right\rangle $
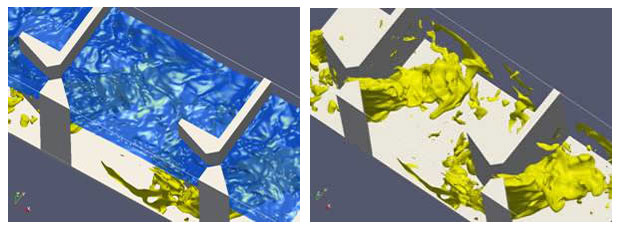
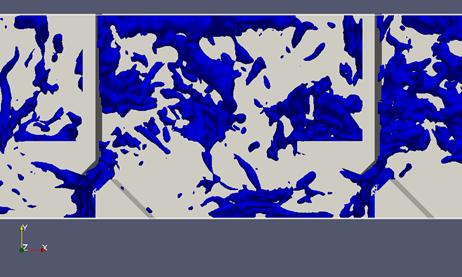
An examination of the turbulent pressure field shows, that the turbulent pressure inside of vortices is negative. The local minimum values of the turbulent pressure indicates cores of large scale vortices, as shown in Figure 2. In the fish passage, several horizontal rollers can be observed. The vortices are formed inside the shear layer of the sluice. With increasing running distance of the vertices, the turbulent pressure inside the rollers increases due to the increasing vortex diameter and the decreasing turbulent pressure amplitude.
Analysis of the turbulent pressure in open channel flows in relation to coherent structures is quite difficult. Large scale vortices can rarely be detected by direct observation. This is due to the fluctuations of the water surface and the related pressure fluctuations inside the entire current. The pressure fluctuations invoked by surface waves decrease with the water depth z by the following exponential law [Kundu, 2004]:
$latex {p}’\propto {{e}^{{-kz}}}$
An examination of the turbulent pressure field shows, that the turbulent pressure inside of vortices is negative. The local minimum values of the turbulent pressure indicates cores of large scale vortices, as shown in Figure 2. In the fish passage, several horizontal rollers can be observed. The vortices are formed inside the shear layer of the sluice. With increasing running distance of the vertices, the turbulent pressure inside the rollers increases due to the increasing vortex diameter and the decreasing turbulent pressure amplitude.
Analysis of the turbulent pressure in open channel flows in relation to coherent structures is quite difficult. Large scale vortices can rarely be detected by direct observation. This is due to the fluctuations of the water surface and the related pressure fluctuations inside the entire current. The pressure fluctuations invoked by surface waves decrease with the water depth z by the following exponential law [Kundu, 2004]:
The superposition of different pressure fluctuations makes it difficult to detect large scale coherent structures near the surface.
Q-Criterion
Another tool for vortex detection was proposed by Dubrief (2000) and Hunt (1988), who compared isosurfaces of the pressure, of the vorticity and of the Q-criterion. The Q-criterion is calculated as:
$latex \displaystyle {{\tilde{\Omega }}_{{ij}}}=\frac{1}{2}\left( {\frac{{\partial {{{\tilde{U}}}_{i}}}}{{\partial {{x}_{j}}}}-\frac{{\partial {{{\tilde{U}}}_{j}}}}{{\partial {{x}_{i}}}}} \right)$
and
$latex {{\tilde{S}}_{{ij}}}=\frac{1}{2}\left( {\frac{{\partial {{{\tilde{U}}}_{i}}}}{{\partial {{x}_{j}}}}+\frac{{\partial {{{\tilde{U}}}_{j}}}}{{\partial {{x}_{i}}}}} \right)$,
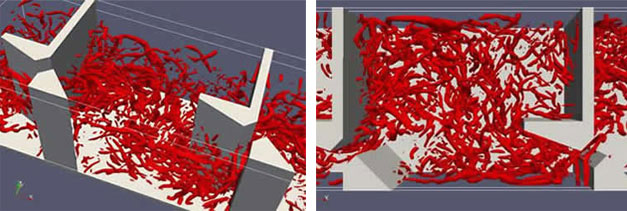
the asymmetric and symmetric part of the spatially filtered velocity gradient. In Fig. 3 the computed isosurfaces of Q~=50s−2 are displayed. With the Q-criterion small scale vortices are detected. Contrary to the turbulent pressure fluctuations, for the calculation of the Q-criterion the free surface condition is not disturbing the detectability. This is because the linear static pressure distribution is not used for the calculation of ∇²p. In the flow small hairline vortices in the stream-wise direction can be seen.
Discussion
Visualizing vortices of different scales gives the engineer a good feel for the coherent structures, which fish have to pass on their way through the channel. The detected large scale rollers are the main structures. Fish have to stabilize in the flow against these structures. The axes of these rollers are partly perpendicular to the main stream direction, which enables the fish to use their main fin for stabilization.
The small-scale structures are parallel to the swimming direction of the fish. As fish can only use their vertical fins for stabilization in these vortices, they must expend more effort for stabilization than in the large-scale rollers.
With the computed LES results a preliminary discussion between biologists and engineers of the flow conditions inside the fish passes can be started. The detected turbulent structures are important for the success of the fish passes, as the passage through these structures may require more energetic effort than passing through high velocity areas.
In the next months, at the Federal University of Minas Gerais in Belo Horizonte, Brazil, a series of laboratory experiments will be conducted to verify the correlation between these turbulent structures and the ability of fish to navigate these structures.
References
Dubrief, Yves; Delcayre, Frank: On Coherent-vortex identification in turbulence. In: Journal of Turbulence 1 (2000), pp. 1-22
Haselbauer M.: Geräuscharme Fischaufstiegsgerinne – Experimentelle und numerische Analyse des Fischpasses vom Typ periodische Schütze. PhD-Thesis, Fachgebiet Hydromechanik, TU München, 2008
Hunt, J.C.R.; Wray, A.A.; Moin, P.: Eddies, streams, and convergence zones in turbulent flows. In: CTR-S88 (1988), pp. 193-208
Kundu, Pijush K; Cohen, Ira M: Fluid Mechanics. San Diego: Elsevier Academic Press, 2004
Wilczak, J. M: Large-scale eddies in the unstably stratified atmospheric surface layer. Part I: Velocity and temperature structure. In: J. Atmos. Sci. 41 (1984), pp. 3537-3550
Acknowledgement: All results were post-processed with Paraview.


