
A Life in CFD by Dr. C.W. “Tony” Hirt
The views and opinions expressed in this article are the author’s own and do not represent those of Flow Science Inc. or its affiliates.
I have spent 60 years working in computational fluid dynamics (CFD). These notes consist of personal remembrances, history, incremental advances, and a discussion of where CFD is today and where it will be in the future. Predicting the future of CFD is not so easy. The reasons for this and what might be possible in the future are briefly discussed. Along the way, it is hoped that readers will get some idea of what it was like to pursue CFD from its beginnings when pre and post processors, advanced programing languages and graphic display methods were not available, not to mention that the computers back then had little memory or speed.
Joining Group T-3 – How it all began
The history presented here is primarily about the Los Alamos National Laboratory Group T-3, which was headed by Dr. Francis H. Harlow, originator of many fundamental computational techniques for modeling fluids that are still used today. I was lucky to be invited into this group at the beginning of my career in 1963 after being a summer graduate student in 1960 and 1961, where I discovered that CFD was an interesting and rewarding activity to pursue. In Group T-3 members worked in teams, so anything that I contributed to new computational methods was done in collaboration with other group members.


What is CFD and why do we need it?
To begin any discussion of the future of CFD, it seems appropriate to question whether CFD will be important and useful in the future. This question was addressed in a short article, Why CFD? The short answer is that there are many things CFD can contribute to understanding fluid dynamic processes that cannot be studied in any other way. This is why CFD will continue to be important and should be the subject of considerably more development.
It is clear to everyone involved with CFD that the major advancements in computational speed and complexity over the past 60 years have been on the hardware side, which has exhibited an exponential growth in computer memory sizes and speeds as well as reduced cost for computer components. Over the same 60 years, computational methodology has not advanced in any dramatic way. The reasons for this lack of advancement are varied and are partially answered later in this article.
Computational fluid dynamic modeling is based on the idea of using computers to solve mathematical equations describing the dynamics of a fluid. Such equations are the equations of conservation of mass, momentum, and energy. These equations are typically partial differential equations that describe, for example, the change in mass of a small element of fluid over a short period of time. Such advancement occurs by interactions of the fluid element with its environment. That is, the mass particle is moved over a short period of time through its local neighborhood whose property variations are estimated by spatial gradients, i.e., partial differential equations. Computationally, the idea is to repeat these small incremental changes for all the particles in a fluid over many small time steps to evolve the dynamics of a large fluid region.
In general, there seems to be no way to avoid the use of advancement in small time steps for the dynamics of every fluid element to have an accurate time-dependent solution. Some simplifications may be made for special cases, but the basic incremental time advancement of small fluid elements would appear to be essential.
If the idea of CFD is to advance the motion of small fluid elements through a sequence of small time increments, then the only way to speed up computations is to do more such incremental advances in a given time. The current trend in CFD takes advantage of computer processors with multiple CPUs, parallel computing and cloud computing, all of which take advantage of many processors all at one time. Again, this is a hardware advancement, not a new way to solve the fluid dynamic equations of conservation.
The role of particles in CFD
To see where we are today it is useful to review where CFD started. For that, there are a couple of issues that must first be addressed. For instance, what is meant by a fluid particle or element? This can be answered in a variety of ways. Typically, a fluid region is divided into a set of volumetric elements in the form of some sort of grid. Alternatively, a fluid can be condensed into a set of mass particles, often an attractive option. Or a fluid may even be represented by an expansion in a series of mathematical basis functions (e.g., as in solid mechanics).
Lagrangian vs. Eulerian particles
Whatever choice is made for “particle” there are two views, or choices for the reference frame, used to advance the equations of motion. One is the Lagrangian method in which the fluid particles move with the fluid, while the other is the Eulerian method in which the grid remains fixed in space and the fluid is moved through it. Historically, only the Lagrangian method was used in the early days of computing to study converging and expanding spherical masses of fluids associated with explosions being developed in the Manhattan Project during WWII.
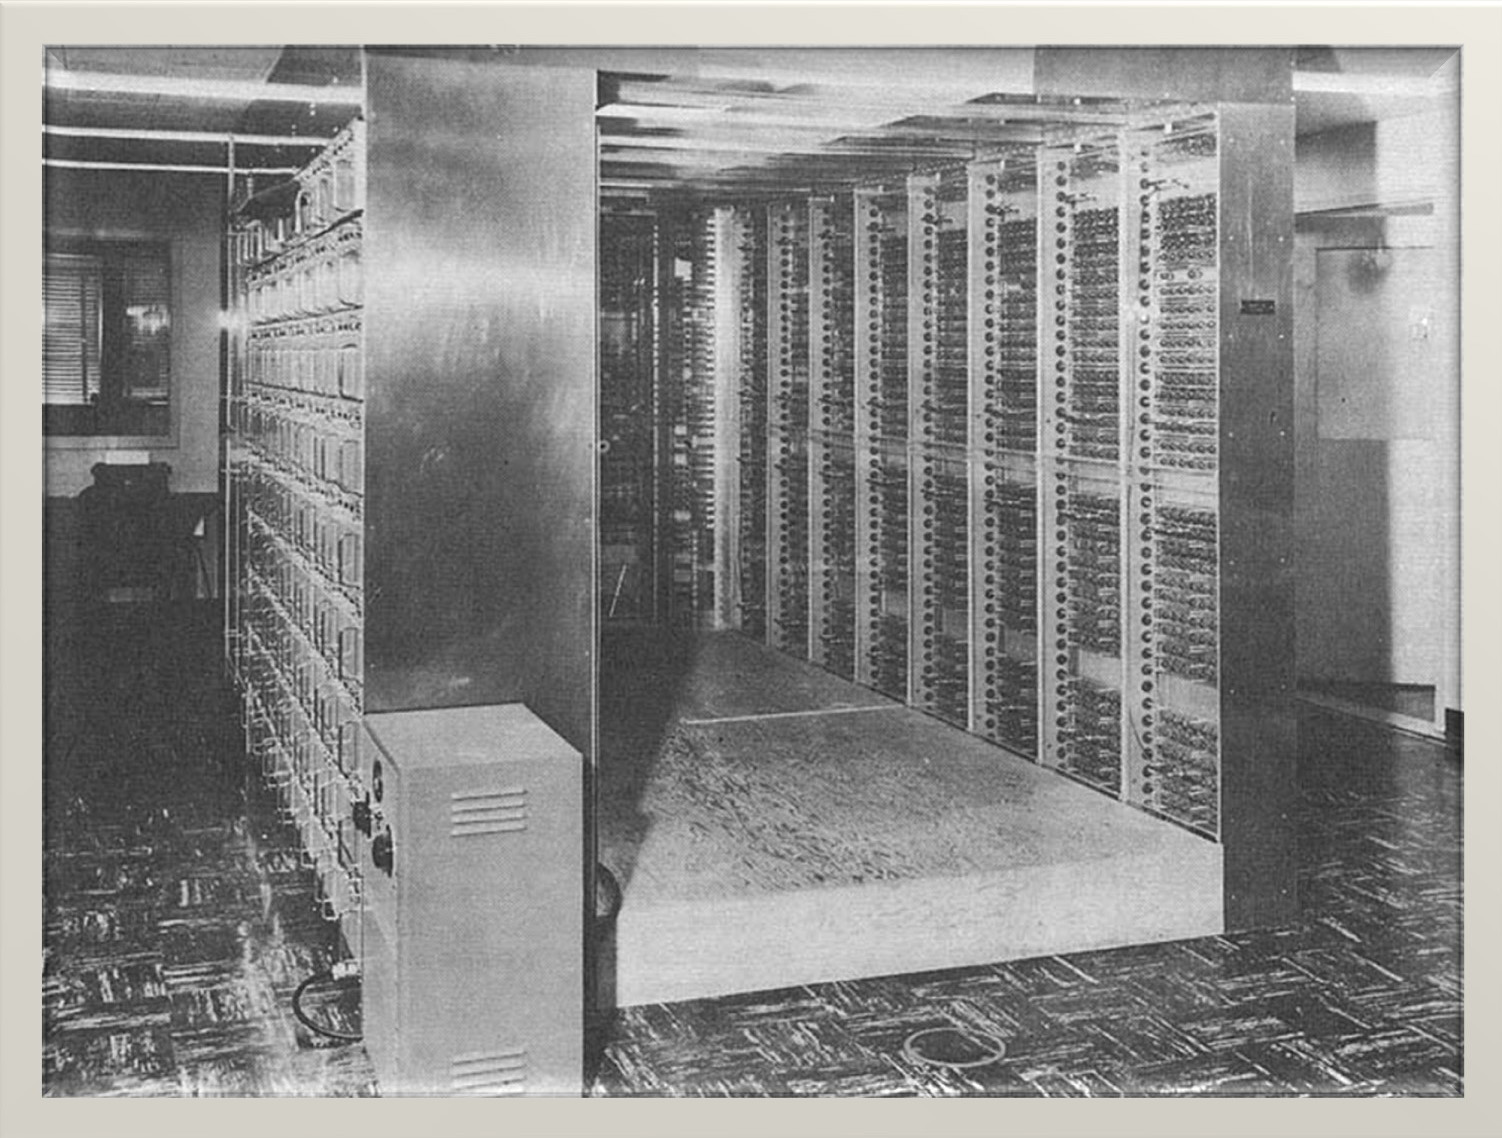
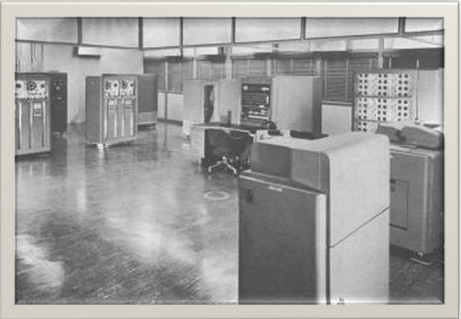
Simple one-dimensional, Lagrangian models were also used to investigate shock interactions passing through layers of different materials. Because of the limited memory and speeds of the earliest computers these models were typically confined to a small number of fluid elements. For example, Francis Harlow reported that his earliest use of a computer to solve fluid dynamic problems typically involved 25 one-dimensional Lagrangian elements that took on the order of 1 hour of computer time on the first commercial IBM 701 computer [1]. Harlow also reported that he thought the same computation could be done on his mobile phone in a couple of milliseconds.
The extension of the one-dimensional Lagrangian models to more dimensions creates some difficult problems. Foremost is the fact that such things as grid elements do not retain their shape as they move, for example, they typically undergo shears that distort them so much that they can no longer be used for accurate numerical approximations. To overcome this problem some scheme must be introduced for rezoning the grid to undo large distortions. That means introducing some sort of averaging process to convert between old and new grid shapes.
Averaging always introduces some smoothing and therefore may introduce a loss of fine scale details, something that is difficult to avoid. Many researchers have proposed different averaging methods, attempting to reduce the smoothing process and, in some cases, obtaining improved results. However, there is no perfect answer because the distribution of the material in a grid element is unknown. The amount of material may be known, but how it is distributed is not. Thus, subdividing the material for a new rezoned distribution cannot be perfect.
Programming back in the day
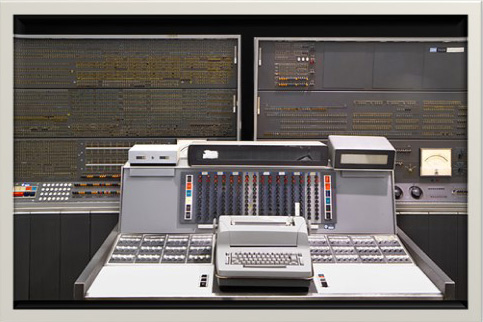
A little history is in order. As late as 1963, the computer programs developed at Los Alamos were written in machine language, which required dedicated programmers. Developers would write out the equations they wanted solved and give them to the programmers to translate into machine language. If a bug appeared, debugging consisted of the programmer, with a listing of the program, and a developer, with his list of instructions, sitting down together. The programmer would say something like “quantity so and so is added to such and such,” and the developer would agree with that operation. Eventually, step by step, a mistake would be found in which the program was not doing what the developer wanted. It was a time-consuming process, yet it was, in some ways, a social and enjoyable process.
The programmers would then take their programs, most often a deck of punched cards, to the computer. They could sit at the computer console and watch all the flashing lights on a dashboard, and based on the lights that were flashing, they could tell, for example, when the computer was doing multiplication or a division. Those days quickly changed with the introduction of programming languages like FORTRAN and professional computer operators, and programmers could no longer sit at the computer consoles.
One of the first multi-dimensional CFD programs – the PIC method
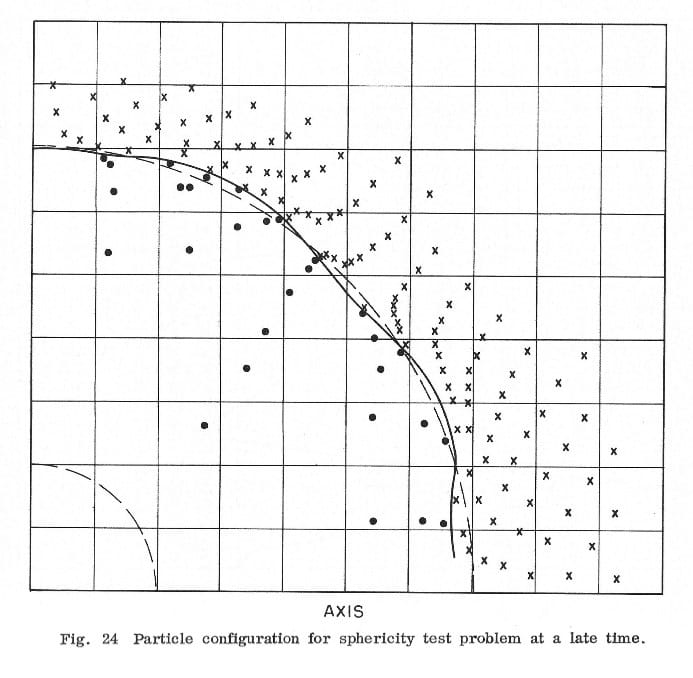
One of the earliest two-dimensional CFD programs to be written was the particle-in-cell (PIC) method created in 1955 by Frances Harlow [2]. This was an innovative development because the program could model the compressible flow of multiple materials undergoing large distortions, something that no other computer code could do. The PIC method combined both Eulerian and Lagrangian elements by using a fixed Eulerian grid of rectangular elements and mass particles, which are Lagrangian elements, to represent the different fluid materials. The motion of the mass particles carried the fluid material from one grid cell to another. Of course, this required the averaging of the particles in a grid cell at the end of a time step to determine the new density and pressure in each grid cell. Velocities were computed with respect to the Eulerian grid and interpolated to the particles to move them. The PIC code was for compressible fluids, the application of most interest at Los Alamos in the early days. Today there are numerous variants of the PIC method, including three-dimensional versions and schemes to smooth out the particles to reduce the discrete changes in material properties when a particle moves from one cell to another.
It might also be mentioned that there were no graphic display methods available to display the results of a PIC computation, so Frank and his team had to plot all the particles on a piece of paper by hand, Fig.1. Of course, the computers at the time were also limited in memory so results were limited in the number of particles that could be plotted (not a very satisfying trade off). This hand plotting was later replaced by a commercial pen plotter that used two perpendicular wires laid across a sheet of paper with a pen held at the crossing of the wires. The wires would be moved to the x and y coordinates of a particle according to input data and then the pen would place a mark on the paper. This sped up the plotting and was more accurate than the hand plotted results.
Plotting along
It was quite some time before better graphic display software became available. Until that time, a CFD program would typically have input data for plots written out at the beginning of the program and during execution, requested plots would be generated as part of the program. In other words, there were no pre or post processors available to CFD users. To get different plots it was necessary to rerun the program.
Plotting results were next improved by displaying results on CRT screens that were then photographed on 35mm film. These films could be displayed on viewers that projected the images onto a screen. Programmers submitted their programs on decks of punched cards and after being run by the computer operators, they would retrieve the output in the form of printed results on large pages of paper stacked accordion style, plus a reel of 35mm film. Some programmers accumulated stacks of output paper so high they were in danger of having the piles fall on top of them.
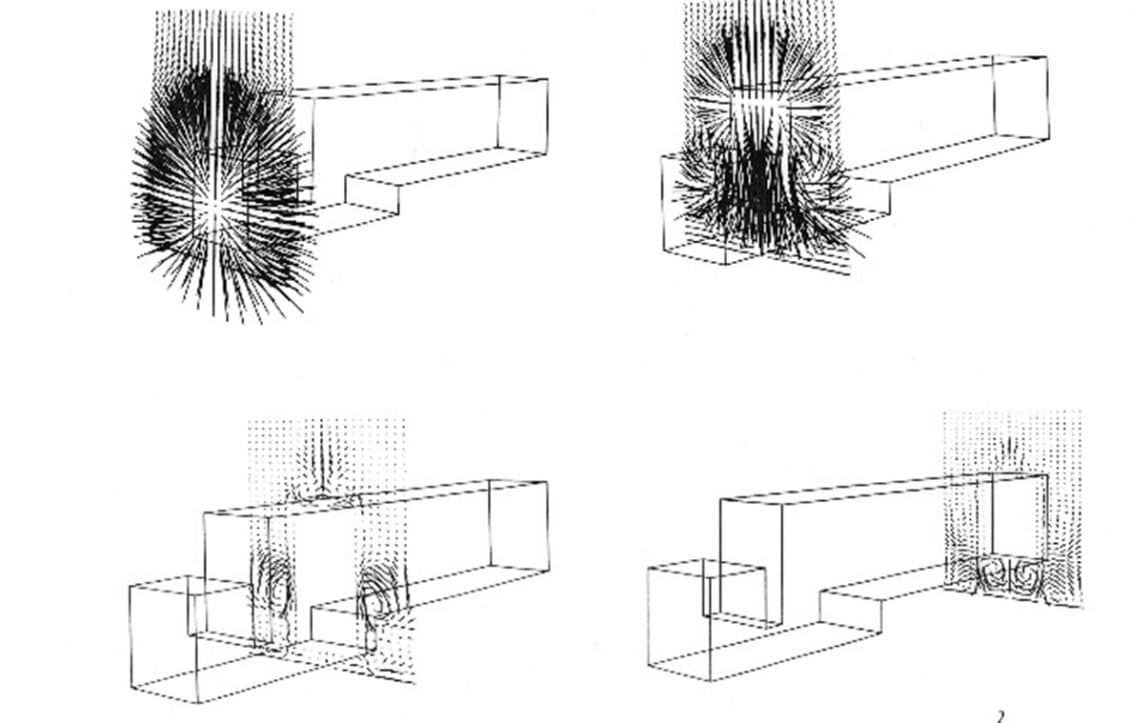
When three-dimensional simulations became possible because of hardware advances in the 1970s, the need for better graphic displays was essential. Trying to understand a three-dimensional flow structure using only two-dimensional plots is difficult. Consequently, a three-dimensional perspective plotting capability was developed in Group T-3 with some simple hidden line capabilities [3]. An example can be seen in Figure 2 without hidden lines, of flow over a simplified cab and trailer configuration, where multiple vortices are seen along the top and bottom surfaces of the vehicle. This flow structure was not evident until revealed by the 3D plots.
The arbitrary Lagrangian-Eulerian (ALE) method
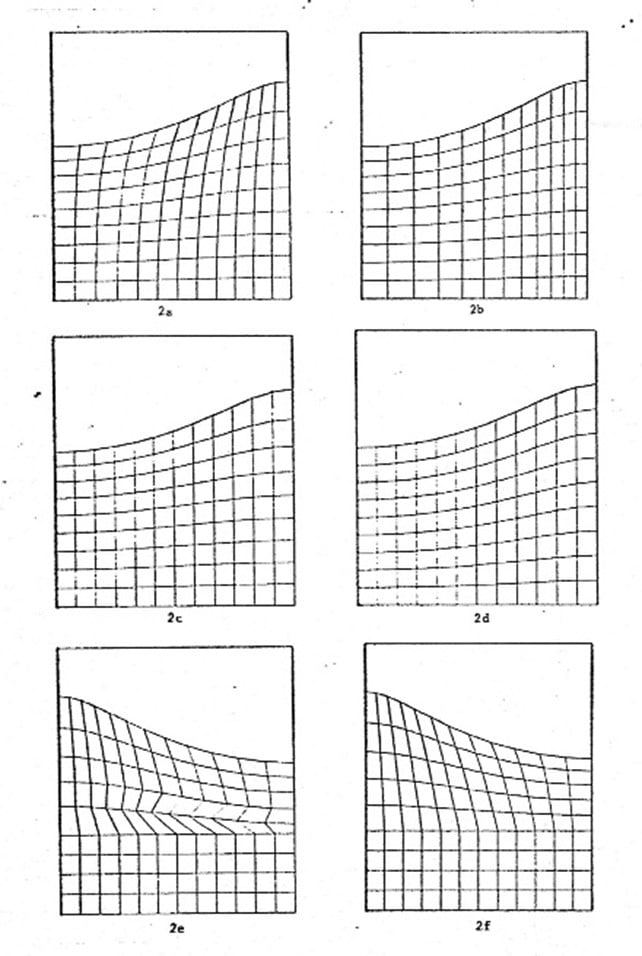
The idea of combining Lagrangian and Eulerian methods in one program, as was done in the PIC method, was the inspiration for what is now referred to as the arbitrary Lagrangian-Eulerian (ALE) method, another Group T-3 advancement. Should you want to move a Lagrangian grid line to a new position to straighten a distorted grid cell, you compute how much mass, momentum, and energy the line sweeps across when moved and subtract and add those amounts to the grid cells on either side of the grid line. This is a specialized rezoning method that allows arbitrary possibilities for the movement of grid lines.
One possibility, of course, is to return the grid back to its initial shape, which would make it a Eulerian model. But the advantage of the ALE method is that you can limit the amount of rezoning to only what seems necessary and, in this way, reduce the amount of smoothing that rezoning introduces. Figure 3 illustrates the technique in its first publication [4].
The majority of Eulerian CFD codes today do not use PIC particles, but instead try to improve the estimate of mass, momentum or energy that moves across a grid cell boundary from one cell to a neighboring cell in each time step interval. A simple example illustrates a fundamental problem with this process. Consider a one-dimensional arrangement of grid cells lined up in the x direction. Suppose there is some color concentration in a cell numbered i and none in any of the cells for larger i values. If there is a uniform flow U in the positive x direction, a simple estimate can be made for color concentration that moves from cell i into cell i+1 in a time step δt that is AUδtC, where A is the area of the boundary between the cells and C is the color concentration. The coefficient of C is the volume of fluid moved across the cell boundary with the speed U in time interval δt. This concentration change would then be averaged in with the existing concentrations in cell i and cell i+1. Cell i+1 now has some non-zero color concentration.
Here’s the rub: in the following time cycle, some of this color in cell i+1 will be advected into the next cell i+2 because it has been mixed uniformly into cell i+1. And for each additional cycle, some color will be advected into more downstream cells, resulting in the color moving faster than the flow velocity. This is often referred to as numerical diffusion. There has been a large amount of work to devise different methods to minimize this behavior. It can certainly be improved, but unfortunately not eliminated.
The idea of using particles, as in the PIC method appears at first sight to have some advantages since the location of a particle carrying some color is known precisely and it could require several time steps to move across the i+1 cell before entering cell i+2. The difficulty with this approach is to define exactly what the particle represents. It is likely thought to be a small region of fluid, but the assumption that it will remain a small region of fluid may not hold.
Physics inspiration over the years – anecdotes and observations
Smoking a pipe – understanding material distribution
A small personal experience may be useful to support this problem of using particles. Years ago, I was watching home slides one night when I was still smoking a pipe. Out of curiosity I blew a small puff of smoke into the light cone from the projector. What blew me away was that that puff didn’t remain a simple blob and certainly didn’t diffuse isotopically as generally treated in turbulence models. Instead, it was immediately sheared out into thin curtains of smoke by the eddies in the air. The initial puff was quickly dispersed into a region that was no longer local but had one or more dimensions that were much larger than the diameter of the original puff. That picture has remained vivid in my mind. I’ve often tried to think what could be done to better model such dispersion. I still have no clue!
The point of this discussion is that you have no idea of how material is distributed in a grid element. Some people believe introducing particles, like the smoke puff, is one way to improve advection between grid elements, but it is not much of a solution as the smoke puff testifies to. The dispersion of material in a particle is not well represented by Lagrangian methods, including particles themselves. Some “rezoning” must be done to account for the shears and other distortions occurring in the flow. A puff that immediately spreads out into thin sheets of smoke is no longer a “particle.”
The problem with scales
A problem of scales occurs in CFD in many ways. It is often the case that there are small scale phenomena associated with fluid flows that are mostly covering large scales. For example, thin boundary layers, or fine scale details of shock waves that affect larger scale behavior. Incorporation of both large and small scales in a computational model is difficult. Not only the problem of devising a grid that accommodates both large and small scales, but also small sizes, for example, may require small time scales as well, making it computationally expensive to simulate the times appropriate for the larger scales. Typical solutions to such problems are to introduce approximations to the small-scale processes such as wall frictional losses or artificial viscosity to spread out a shock wave to where it can be resolved with a coarser grid. These often require specialized treatments and are not generally available in most CFD codes.
Gridding approaches – introducing FAVOR™
Another important issue with CFD grids is how to represent a complicated flow region such as a die for an engine block casting or an intake, a spillway, and other important elements of a hydroelectric power plant. The majority of commercial CFD codes use what are called “body fitted grids”, in which the grid elements are distorted to allow their faces to lie on curved solid surfaces. Finite difference approximations are more complicated when the grid elements are not simply rectangular, but that is the price to pay for conforming to complicated shapes. Generating such grids is not a simple process, especially when the elements should not change in shape and size too much between neighboring elements. If some solid object is to move, such as an opening/closing valve, or rotating crankshaft or flying projectile then the grid would have to be changed each time step and its state values recomputed. Not a very convenient or efficient computational method.
There is an alternative gridding scheme that is worth mentioning [5]. It is the Fractional Area Volume Obstacle Representation (FAVOR™) method. The basic grid is a simple rectangular mesh, possibly with varying element sizes. In each grid element the open volume fraction of the element, not blocked by an obstacle, is stored, and the open area fractions of the sides of the element, not blocked by obstacles, are also stored. This is a kind of generalized porous media approach. The advantage compared to body fitted grids, is that the underlying grid is very simple and easy to set up. Computing the areas and volume fractions blocked by obstacles can also be done with relatively simple preprocessor routines. Of course, the difference equations must incorporate these blockages, but that is not difficult. As for moving obstacles, instead of having to create a new grid each cycle, it is only necessary to make the area and volume fractions time dependent, which is much simpler.
The diffusion of Lagrangian particles
Returning briefly to particles. Suppose particles are introduced as a mass being emitted by some source, for instance, pollution. In addition to advection by the surrounding air flow, this mass should be diffusing. To add diffusion to the particles one option might be to subdivide each particle into several smaller particles each time step with a variety of random velocities, but this approach increases the number of particles exponentially and would quickly overwhelm the computer’s memory. An alternative approach introduced in Group T-3 was to imagine that at each time step a particle is a new source of pollution that spreads out in a Gaussian distribution. But, instead of dividing the particle up, imagine this distribution to be a probability of where the particle might move in a given time step. Choosing random numbers to pick a position in the Gaussian distribution and then moving the particle to that location approximates the process of diffusion. One can think of the selection of random numbers as a Monte Carlo sampling process or as each particle undergoing a random walk process [6], see Figure 4.
![Figure 4. Random velocity particle diffusion compared with theory for a Gaussian puff [6]. Figure 4. Random velocity particle diffusion compared with theory for a Gaussian puff [6].](https://eadn-wc05-12201999.nxedge.io/cdn/wp-content/uploads/2023/08/Figure-4.-Random-velocity-particle-diffusion-compared-with-theory-for-a-Gaussian-puff-6.jpg)
The bottom line
The bottom line for CFD is that numerically computing the dynamics of a fluid is not an easy problem, in general. Some of the fundamental problems have been outlined above. There are, of course, some special problems for which simpler methods may be introduced that can reduce computational effort. The example of “incompressible fluids” is one case that deserves mention.
Historically it was thought that if you used an equation of state for a fluid simulation that it would apply to any type of fluid, compressible or incompressible. The reality is not that simple. If one tries to compute an incompressible fluid in which the fluid speeds are much smaller than the speed of sound in the fluid, it is still necessary to track all the sound waves bouncing around based on the equation of state, but that requires a great amount of time, and it turns out, that one cannot average out the pressure waves in any simple way. For these reasons an alternative solution procedure was developed in which an implicit treatment was used to solve the vanishing of the fluid divergence expression, which implies incompressibility.
The introduction of the marker-and-cell (MAC) method
The first incompressible fluid code for two-dimensional applications was again a creation of Francis Harlow, who introduced a flood of new developments in a single advancement called the marker-and-cell (MAC) method [7]. To ensure incompressibility, Harlow devised a way to drive the velocity divergence for each cell in a Eulerian grid of rectangular cells to zero. First, he modified the placement of velocity components in a cell from the cell center to the respective faces for each velocity component, such that each face of the grid cell stores the velocity component normal to that face. Nowadays this is referred to as a staggered grid.
This made it easy to compute the volume of fluid passing through each cell face in a time step. Clearly, if there is a net flux of volume out of the cell then reducing the pressure in the cell (still located at cell center) will reduce all velocity components at the cell’s faces and hence the net outflow. If there is a net flux into the cell an increase in the pressure will increase the velocities out of the cell, which reduces the inflow. The actual computational process requires an iteration because an adjustment in one cell will affect the net flow in all its neighboring cells since they share the faces. This carryover to neighboring cells can be somewhat accounted for by over-relaxing the change in pressure needed to drive a cell’s divergence to zero.
In this way the MAC method, using a pressure-velocity iteration, was able to generate a velocity field that satisfied a zero divergence in every grid element (to some degree of convergence). But there was more to MAC. Because of the use of Marker particles that were placed only in grid elements that contained fluid, while elements without markers were treated as void elements, this meant the MAC method was able to model fluids having free surfaces, another first, as shown in Figure 5.
The implicit treatment – a pressure-velocity iteration – smoothed out and damped the pressure waves. An important feature of the incompressible method is that the pressures introduced are not physical pressures, that is, pressures arising from an equation of state, but pressures needed to drive the velocity divergences locally to zero. It’s an artifice that works well.
![Figure 5. MAC example of the collapse of a reservoir of fluid, showing its free surface capability [7]. Figure 5. MAC example of the collapse of a reservoir of fluid, showing its free surface capability [7].](https://eadn-wc05-12201999.nxedge.io/cdn/wp-content/uploads/2023/08/Figure-5.-MAC-example-of-the-collapse-of-a-reservoir-of-fluid-showing-its-free-surface-capability-7.jpg)
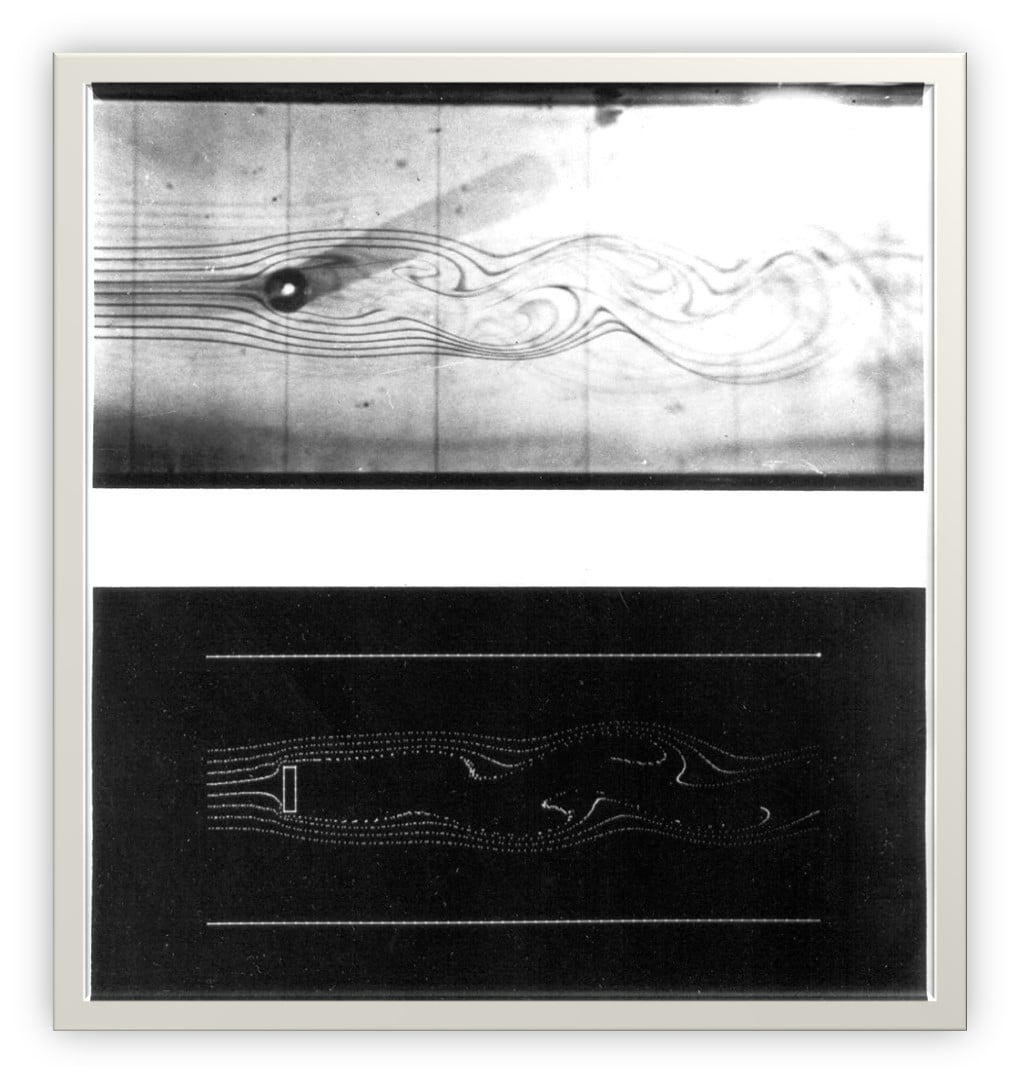
Basically, the idea is to determine the pressure needed in each computational grid cell that will make the velocity divergence in that cell, i.e., a net zero volume flow across the sides of the cell), equal to zero,
Harlow did this by replacing each velocity component in the divergence, for example u by its difference equation,
Where $latex \displaystyle \overline{u}$ contains the initial velocity un plus all the accelerations of u except that of the pressure gradient. This leads to an equation for p that includes the cell pressure and all its neighboring cell pressures, which is a Poisson equation. Boundary conditions are a little complicated because at a solid wall, for instance, the pressure to be set outside the wall must be chosen to keep the normal velocity on the wall zero. Solving these equations simultaneously for all the cells in the grid can be done, for example, with a simple Gauss-Seidel iteration. This approach may be compared to an alternative approach that was published a couple years after the MAC method [8] in which the author, A.J. Chorin, simply set a change in cell pressure to be proportional to the negative of the velocity divergence,
Here divergence is evaluated in terms of the new time-level velocities and α is a relaxation coefficient. This approach eliminates the complication of setting pressures outside solid walls, instead it simply sets the normal velocities to zero directly. The principal difficulty with this approach is that the relaxation coefficient α must be chosen experimentally; too small and convergence is too slow, too large and the iteration is unstable. This author was trying to apply the Harlow technique for incompressible flow to a two-dimensional Lagrangian grid, where because of the distorted geometry of the grid cells, complicated numerical pressure gradient expressions appear in the velocity divergence.
A light came on that a simple combination of the two approaches for incompressibility could be combined into a much simpler and better method than either of the original methods, by using the velocities directly, as in the second method, and using the Harlow approach to analytically evaluate the exact value of the relaxation coefficient α to use. This is the approach used ever since by many modelers because it replaces the use of a constant relaxation coefficient with something that also accounts for variable grid sizes and different types of boundary conditions.
One problem with the MAC method was that it was not computationally stable unless enough viscosity was introduced. The amount of viscosity needed was determined by experimentation. This problem was not fully understood until an analysis of the truncation errors arising from finite difference approximations provided explanations about why some approximations were unstable [9]. In the case of the MAC method the culprit was using centered difference approximations for the advection terms. By changing to an upstream, or donor, cell approximation, for example, the instability was eliminated, and it was no longer necessary to introduce viscosity.
The challenge: Capturing physical accuracy with numerical models
Truncation errors
Looking at truncation errors associated with difference equations has opened many possibilities because it gives quite a bit of information about what is generated by a numerical approximation. Researchers are always interested in improving accuracy, so they spend considerable time trying to devise higher order approximations. One way to do this is to first evaluate the truncation errors and then add terms to the difference equations to cancel those errors. One case of truncation error subtraction that was quite successful for the modeling of chemical lasers was done by members of the fluid dynamics group T-3 [10]. Why more examples of subtracting truncation errors have not been done is curious. One reason for this might be that truncation errors that are higher order involve higher order derivatives and writing approximations for such terms involves reaching out in a grid over more than just one or two grid elements. This becomes a problem at material boundaries where there are no grid elements extending outside the boundary.
Incompressible flows
Incompressible flows have been a remarkable success, but they are not without their limitations. A simple example will illustrate one of the difficulties of CFD that needs more attention. The example is the collapse of a steam bubble in a pool of water, a problem associated with steam suppression in light-water nuclear reactors. The injection of the steam bubble is slow enough that the water can be treated as incompressible, but as the steam condenses the bubble is collapsing. At the instant of collapse all the water rushing to fill the bubble space must instantly be stopped if the flow is incompressible. This requires a large pressure pulse to terminate the inflowing momentum, one that is much larger than experimentally observed.
The problem is that the final collapse happens over a small time interval, and the assumption of incompressibility in the fluid is not satisfied during the short collapse time. In this case some compressibility must be allowed for the pressure to propagate out at a certain rate which only stops the incoming fluid momentum out to the distance the pressure wave has traveled at any given time [11].
This complicates the numerical solution a bit but is necessary for physical accuracy. Importantly, it illustrates the need for considerable caution in developing numerical models. Effort must be made to prepare for exceptions and the possible need for the addition of more physical processes to make the models more realistic. This is one major area of development necessary for the future of CFD.
The breakthrough of the VOF method
The use of marker particles in the MAC method was a breakthrough that allowed free fluid surfaces to be modeled. The use of particles, however, is limited because to minimize the discrete changes in cells gaining or losing particles can only be improved by using many particles. More particles imply more computational time. Additionally, marker particles do not remain uniformly distributed. For example, a drop of fluid falling onto a rigid surface will have the particles collapsing closer together in the downward direction and spreading out more in the horizontal direction. The spreading might even result in grid cells without markers where there should be some.

To remedy this an alternative model was proposed that has caught on as evidenced by currently 19,134 (as of 5/2023) citations to the original publication [12]. This is the volume-of-fluid (VOF) method, in which the fractional volume of a grid element occupied by fluid is recorded by a variable that is typically denoted by the symbol F, for fluid fraction. The advantage of using this variable is that it can range from zero to one, so it does not have the discreteness of particles. Furthermore, it automatically accounts for the breakup or coalescence of fluid masses. For these reasons, the VOF method is now the most often used method for numerically tracking free surfaces and other fluid interfaces.
The origin of the VOF method resulted from models being developed by the T-3 Group for water/steam flows associated with light water nuclear reactor safety studies. In two-phase water/steam modeling it is customary to use a steam volume fraction in the mixture to evaluate the mixture mass and other properties. Musing on this, it was natural to wonder why not allow the volume fraction to have values of 0 and 1, and make that transition be at a liquid surface. For this to work, it required special numerical approximations to keep the interface sharp when it was moved through a grid. The first example of this [13] is shown (crudely) in Figure 6.
A discussion of limitations and what’s next for CFD?
Numerous alternative computational models have been devised for the advection of the discontinuous fluid fraction variable F, although none is perfect. Nevertheless, the models have been extremely successful in solving many fluid problems having multiple and complicated free surfaces.
While the incompressible flow models solve one important problem, they still are based on partial differential equations requiring the advancement of small fluid elements in a sequence of small-time steps. This remains a basic limitation of CFD.
With the continued development of computing hardware, it became possible, in the mid-1970s, to perform fully three-dimensional computations. No new computational techniques were required, only more computations.
What about other approaches to CFD? Is there likely to be a breakthrough technique that will revolutionize the computation of fluid dynamic processes? The past may offer a clue.
Several announcements have been made in the past few years of entirely new modeling methods that are sure to revolutionize CFD and replace the current finite-differencing methods. Included in these developments are the Lattice-Boltzmann method, and the smooth particle hydrodynamics method. While innovative, neither method has come near to reaching its expected revolution. Perhaps more study will increase their applicability. In the meantime, it would be wise to be skeptical of extreme claims, without reliable verifications.
Artificial intelligence (AI) has been suggested as an advance that will greatly improve CFD modeling. This is not clear. AI rests on the evaluation of many simulations and what might be learned from them. However, the choice of examples to include in an evaluation is critical and how can one be assured that all possible physical features are included in the sampling? A real difficulty with AI is that one cannot know what has and has not been included. Because of this the outcome cannot be evaluated at this time.
Quantum computing has advanced recently, and for some special problems has shown great promise. For the vast majority of CFD problems, however, there will have to be many more quantum particles, or qubits, introduced and properly entangled to represent all the complexity of real fluid dynamics. This area requires more study.
Transitioning to commercial CFD

The discussion so far has been on the development of CFD methods, all of which were accomplished under government and/or academic programs. It was inevitable that I would eventually transition to commercial CFD. This happened because all my experience at the Los Alamos National Laboratory was a lucky break, i.e., being in the right place at the right time. Up until the 1980s, the laboratory could not perform work for non-government organizations. Therefore, the application of the CFD methods being developed at the laboratory could not be applied to important problems facing industry.
It was disappointing to see that work believed to be useful to others was not being used. To rectify this, in 1980 I started a commercial company called Flow Science, Inc. Initially the company performed contract work using the new CFD tools. The truth is that a small company cannot easily exist on contract work because it either has too much work and not enough workers, or too many workers and not enough work.
In 1984, Flow Science, Inc. began to sell its software under the name FLOW-3D instead of selling contract work. It was a good decision. At the time there were a few other companies marketing CFD software, so Flow Science made the decision to concentrate on its expertise, which was CFD for fluid problems involving free surfaces.
The company also decided to use a simple gridding technique, instead of body-fitted grids, and to represent geometry using a technique it developed called the Fractional Area and Volume Obstacle Representation (FAVOR™) method [5]. These choices were based on a long history of using many different CFD techniques and have made FLOW-3D a powerful and easy to use software that is used worldwide.
References
- F.H. Harlow, “Adventures in Physics and Pueblo Pottery Memoirs of a Los Alamos Scientist,” p.57, Museum of New Mexico Press (2016)
- M.W. Evans and Francis H. Harlow, “The Particle-in-Cell Method for Hydrodynamic Calculations,” Los Alamos Scientific Laboratory, report LA-2130, (1957).
- C.W. Hirt and J.L. Cook, “Perspective Displays for Three-Dimensional Finite Difference Calculations,” J. Comp. Phys., 3 293 (1975).
- C.W. Hirt, “An Arbitrary Lagrangian-Eulerian Computing Technique,” Proc. Second International Conference of Numerical Methods in Fluid Dynamics,” Uni, California, Berkeley, CA, Sept. 15-19 (1970).
- C.W. Hirt and J.M. Sicilian, “A Porosity Technique for the Definition of Obstacles in Rectangular Cell Meshes,” Proc. Fourth International Conf. on Ship Hydrodynamics,” Natl. Acad. Sciences, Washington, D.C., September 24-27 (1985).
- R.S, Hotchkiss and C.W. Hirt, “Particulate Transport in Highly Distorted Three-Dimensional Flow Fields,” Proc. Computer Simulation Conf., San Diego, CA, June (1972).
- J. Welch, F.H. Harlow, J.P. Shannon and B.J. Daly, “The MAC Method A Computing Technique for Solving Viscous, Incompressible, Transient Fluid-Flow Problems Involving Free Surfaces,” Los Alamos Scientific Laboratory repot LA-3425 (1965).
- A.J. Chorin, “A Numerical Solution of the Navier-Stokes Equations,” Math. Comp. 22 745 (1968).
- C.W. Hirt, “Heuristic Stability Theory for Finite Difference Equations,” J. Comp. Phys. 2, No. 4, 339. LA-DC-8976, (1968).
- W.C. Rivard, O.A. Farmer, T.D. Butler and P.J. O’Rourke, “A Method for Increased Accuracy in Eulerian Fluid Dynamics Calculations,” Los Alamos Scientific Laboratory report LA-5426-MS (Oct. 1973).
- C.W. Hirt and B.D. Nichols, “Adding Limited Compressibility to Incompressible Hydrocodes,” J.Comp.Phys. 34, 390 (1980).
- C.W. Hirt and B.D. Nichols, “Volume of Fluid (VOF) Method for the Dynamics of Free Boundaries,” J. Comp. Phys. 39 201 (1981).
- B.D. Nichols and C.W. Hirt, “Methods for Calculating Multi-Dimensional, Transient Free Surface Flows Past Bodies,” Proc. of the First International Conference on Numerical Ship Hydrodynamics, Gaithersburg, Maryland, Oct.20-23 (1975).
