FLOW-3D v11.2 is all set to be released in a few weeks with many improvements to existing models and new developments. In anticipation of this release, we are turning the focus of our blog series to new developments coming in this release, like the particle model, wave absorbing components, mooring lines and interactive geometry.
One of the major developments is the particle model, which has been significantly improved and expanded in FLOW-3D v11.2. In fact there are so many new capabilities in the particle model, that I will be discussing it in multiple posts, starting with this one where I will discuss mass particles.
In the new model, particles are grouped into the following classes based on their primary functionality:
- Marker particles are simple, massless markers, best used for tracking fluid flow
- Mass particles represent solid objects such as sand grains or inclusions
- Fluid particles are made up of fluid and inherit fluid properties, including solidification
- Gas particles represent bubbles that change their size in response to temperature and pressure loads from the surrounding fluid
- Void particles are similar to the gas particles but their specific function is to represent and track collapsed void regions, which is useful, for example, to predict potential porosity defects created during mold filling in casting
- Mass/momentum source particles represent user-defined mass/momentum sources in the mesh
- Probe particles act as diagnostic devices that record and report solution quantities at their locations; they can be made of particles of any other class
- User particles can be customized through user-defined functions in the source code
Mass Particles
Once the mass particle option is enabled in FLOW-3D, users have the option of setting various mass particle species with varying diameters and densities. Additionally, the dynamics of the mass particles can be controlled by properties like diffusion coefficient, drag coefficient, turbulent Schmidt number and restitution coefficient. Mass particles can even be assigned thermal and electrical properties.
The user can set multiple sources for particle generation, and each source can have a mix of all or some mass particle species defined earlier. Also, users can choose a random or uniform generation of particles and even define the velocity at which particles are generated from the source. Altogether, there is a lot of flexibility in how the user can use this powerful particles model.
Acoustophoretic Particle Separation
Acoustophoretic particle separation is one of many applications where mass particles can be directly used. Acoustophoretic particle separation represents a modern and efficient way of removing a large amount of objects from solutions in a microfluidic channel. The ability to separate suspended solid objects from a microfluidic solution is an important tool in a wide range of fields including: healthcare (e.g., malignant cell removal), research (e.g., nanoparticle separation), industrial (e.g., sequestration of suspended solids) and environmental (e.g., water purification). In principle, particle separation is achieved by acoustic forces. Principally, these forces are a combination of pressure forces generated by a standing wave field, fluidic drag and impulse forces resulting from collisions of the particles with the channel walls when the amplitude of the oscillation is sufficiently large. Due to this combination of forces, particles that are involved in an acoustophoretic process can be separated depending on their size and density.
To the best of our knowledge there are very few numerical studies on the subject that take into account all the aforementioned force contributions. So, in this article I will present an all-inclusive method of acoustophoretic modeling using FLOW-3D. By taking advantage of FLOW-3D’s unique modeling capabilities, we can readily introduce mass particles inside the domain in a random fashion using the updated particle model and then vibrate the entire domain with a given length amplitude at a specified frequency. The microchannel oscillations along with the rest of our numerical simulation results, can be easily visualized using FlowSightTM and its improved non-inertial reference frame rendering capabilities.
Process Parameters
For the purpose of this analysis, a computational domain defining a microchannel with a square cross-section with 100μm edges and a total length of 1mm was used. A total of 1148 particles were initially introduced in the entire computational domain in a random fashion. We opted to oscillate the entire microchannel at a constant frequency of 10Khz and at multiple amplitudes. The length of the amplitudes ranged from 3.125μm to 50μm. As a general rule, larger oscillation amplitudes require smaller time-step sizes in order to account for the rapidly varying temporal variable changes. Nonetheless, the total analysis time was less than 2h on a 32 core standalone workstation.
Results and Discussion
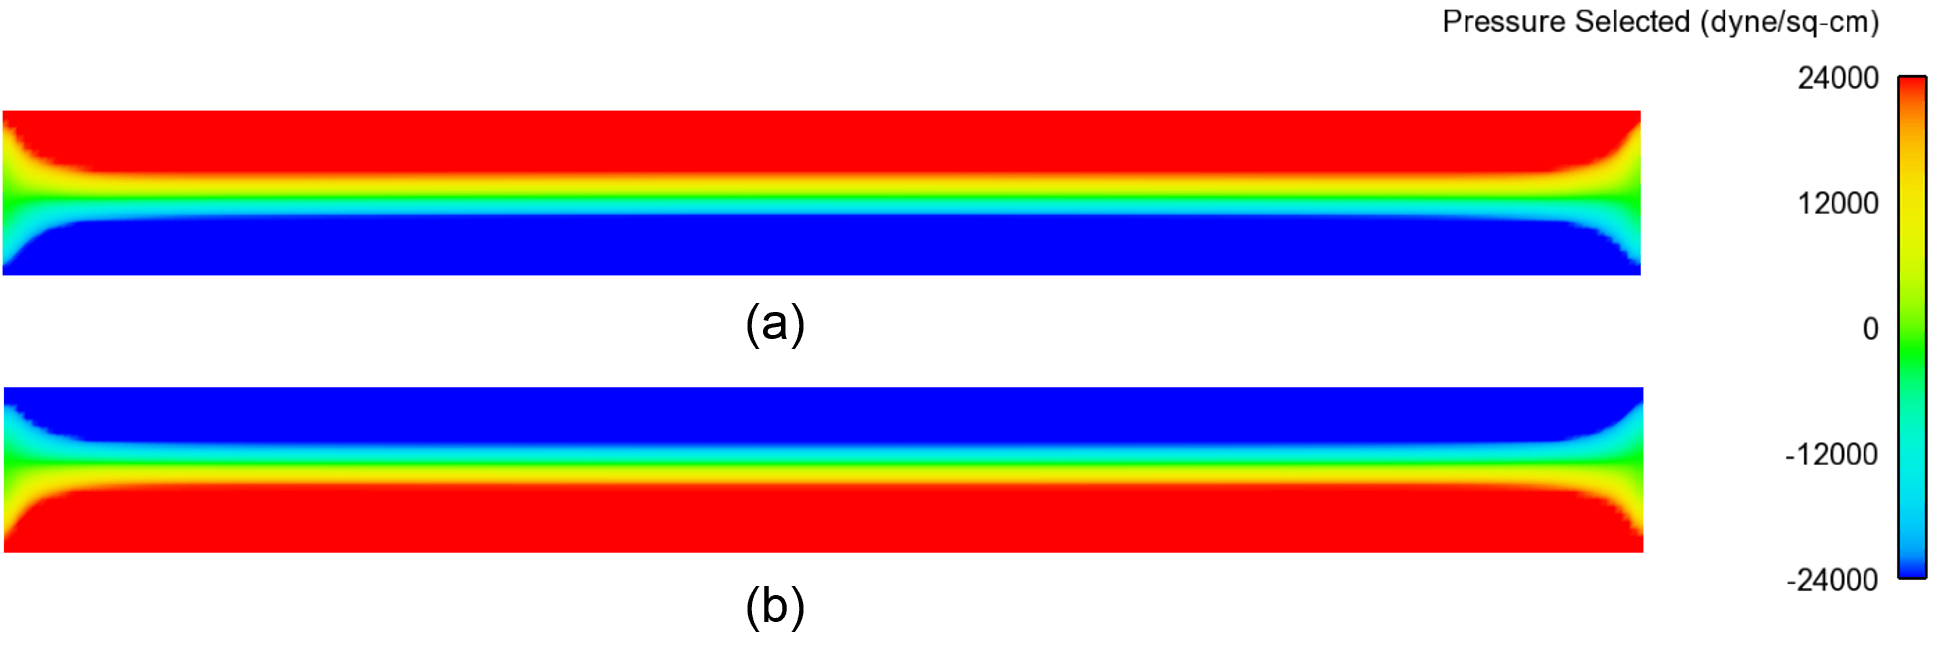
As seen in Fig. 1, the pressure field varies depending on the phase of the oscillation. More specifically, in Fig. 1a, we observe a pressure front located at the bottom of the channel which occurs during maximum upward acceleration while in Fig. 1b, the pressure front is located at the top of the channel which occurs at the time of maximum downward acceleration. Both Fig. 1 results refer to the case of maximum amplitude where the maximum pressure was found to equal or exceed 2400 Pa (approximately 0.24 Atm).
The particle separation animation shows the effectiveness of the acoustophoretic particle separation method and highlights the contributing forces. Note that the particles are affected mostly by pressure and drag forces at low amplitudes, but when the length amplitude of the oscillation becomes similar to the size of the microchannel, the particles are forced into a single separation plane due to impulse forces caused by collisions with the top and bottom walls of the microchannel. It is important to note that the numerical results obtained with this modeling method appear to indicate a separation level exceeding 90% for an overall process time of less than 4ms.
Based on our preliminary analysis, we can conclude that acoustophoretic processes can be a very efficient method of particle separation in terms of time and energy required. And with the improved particle model in v11.2, FLOW-3D represents a very powerful option for modeling such processes due its abundance of physical models and enhanced rendering capabilities.
Stay tuned for the next blog, in which I will discuss the new capabilities and possible applications of fluid particles.
Learn more about the power and versatility of modeling microfluidic applications with FLOW-3D >


