Fugitive Dust Emissions for Different Configurations
This article was contributed by Dhananjay Sharma, E.I., CFM, Hydraulic Modeling Engineer, AECOM.
The effect of wind on open aggregate storage piles is becoming a growing environmental problem around the world. A problem of this nature was observed at a 2.7 km2 iron-ore site. The facility receives ore via rail wagons, which are emptied by a car dumper. The ore then passes through a series of conveyors and transfer points and is transported to one of the stockpile rows. Fugitive dust emissions have been observed as a result of wind effects on the stockpiles.
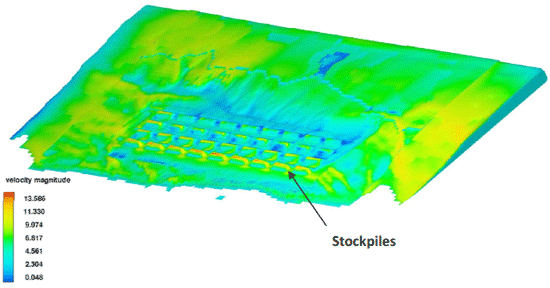
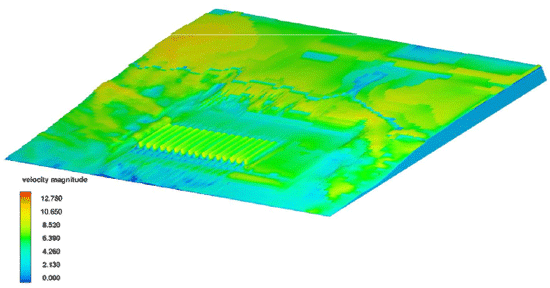
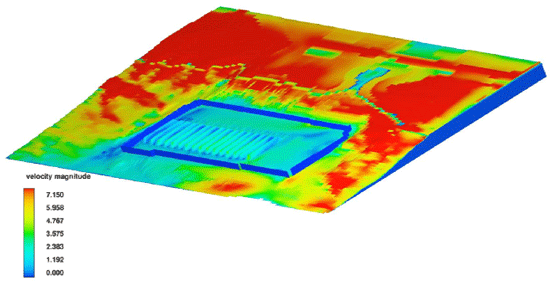
Two different configurations (Options A and B) were modeled in FLOW-3D to study the impact of fugitive dust emissions. Option A has 36 stockpiles with 9 piles in 4 rows and Option B has a total of 16 stockpiles all in 1 extended row.
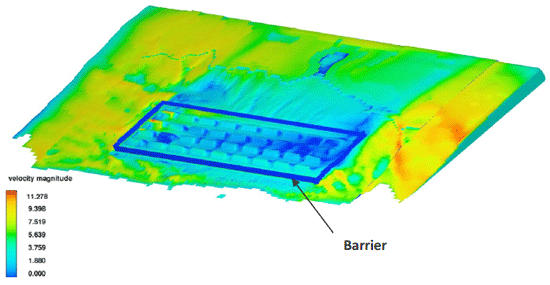
A 30 meter high barrier along the perimeter of the stockpiles could also be modeled in order to compare air velocities with and without the barrier. A wind velocity of 7.5 meters per second (m/s) referenced at 10 meters height was used to model both configurations. Four different wind directions were analyzed for both stockpile Options A and B.
Physical and Numerical Modeling
Initial Model Setup
To model the fugitive dust emissions in FLOW-3D, the air temperature was assumed to be 15°C. A single, uniform, incompressible fluid option was selected. Gravity of -9.81 m/s in the z-direction was used. The fluid was considered to be a viscous and turbulent flow. The two-equation (k-e) model was used to calculate turbulence with no surface friction for both Options A and B configurations.
Initial Conditions
A velocity profile based on a 1/7 power law (approximately a logrithmic law-of-the-wall distribution) was assigned as an initial condition for each of the simulations. The reference velocities of most interest for the stockpile analysis are 12 and 7.5 m/s. An analysis was performed by increasing the wind speed and measuring its effect on velocities adjacent to the piles, which determined that Reynolds scaling holds for these velocities (i.e., linear relationship between incoming wind speed scaling and velocity scaling adjacent to the piles). FLOW‐3D simulations were then constructed using a velocity of 7.5 m/s only. The results from these simulations can be scaled to meet the 12 m/s condition.
A wind profile power law was used to extrapolate velocities for various heights above and below 7.5 m/s at 10 meters. This method of applying velocities at a boundary does not allow for terrain variations along the boundary The reference velocity was assigned at 10 meters above sea level for the West, Southwest and South wind directions. For the East wind direction, the velocity was assigned at the reference height of 10 meters above grade at the back (Y-max) boundary.
The wind profile power law was calculated at every meter up to 360 meters in the z-direction. Velocities were averaged over intervals equal to the mesh sizing. There were 10 height intervals at which velocity was assigned: 2, 4, 6, 8, 10, 20, 70, 181, 270 and 360 meters. After establishing a velocity profile, the values for each height interval were broken down into their X and Y components for each of the four wind directions (West, Southwest, South and East). The initial conditions were assigned at the exterior face of the mesh blocks, leaving sufficient horizontal space for the velocity profile to develop before reaching the stockpiles.
The Wind profile power law is:
Ux = wind speed at height x
Ur = wind speed at reference height
Zx = height x
Zr = reference height
α = 1/7 ‐ atmospheric stability coefficient
Geometry
Three stereo‐lithography (STL) files were created and incorporated in the model; the individual files correspond to the topography, stockyard and piles. Different STL files were generated for Options A and B.
Meshing
The model domain was adjusted for each of the wind directions. The mesh size varies from 2.4 million to 3.3 million cells for Option A and 1.3 million cells for Option B. A cell size of 2 meters high by 4 meters long and 4 meters wide was used in the immediate vicinity of the piles in order to accurately resolve the velocities in that region.
Boundary Conditions
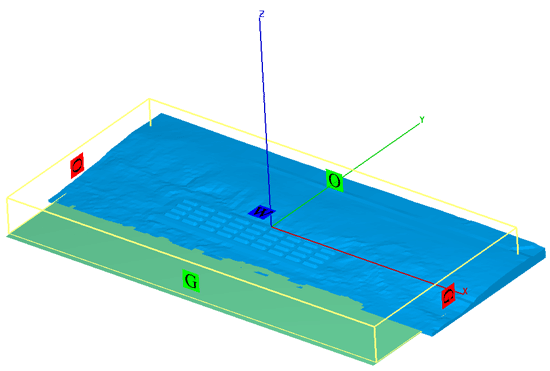
Four boundary types were used in the stockpile simulations. For all wind directions, the top boundary (Z-max) was assigned as stagnation pressure. Depending on the direction of the wind, two of the sidewalls were assigned as outflow boundary conditions. The remaining two sidewalls were assigned a grid overlay boundary. Grid overlay allows the velocity from the initial conditions to enter the model. Nested blocks were used to create the desired mesh resolution and scale. At the interface between the nested blocks, a symmetry boundary condition was used. Symmetry allows information to be transferred between the blocks. Figure 1 shows the boundary condition setup for the West wind direction (y direction). For the other wind directions, a similar methodology was used for applying boundary conditions.
Barrier
The baffle feature in FLOW-3D was used to create the wind barrier around the stockpiles. The baffles for both Options A and B were 30 meters high and were constructed in segments following the terrain. The barriers modeled are porous in nature. The porosity value of 34% (i.e., 34% open area) and corresponding velocity vs. pressure drop values were obtained from a barrier manufacturer. The FLOW‐3D model uses a baffle algorithm where porosity and associated flow losses can be specified. Baffles are infinitely thin and do not occupy any volume.
Simulation Results
Option A
For Option A, four different wind directions were analyzed and were simulated with and without a barrier for a wind speed of 7.5 m/s.
| Wind Direction | Max Velocity w/o Barrier (m/s) | Max Velocity with Barrier (m/s) | Max Velocity Reduction |
| West | 13.586 | 11.278 | 17% |
| Southwest | 13.045 | 10.796 | 17% |
| South | 12.352 | 12.12 | 2% |
| East | 9.76 | 8.597 | 12% |
The maximum velocities for each of the simulations and the reduction in maximum velocity between the barrier and no barrier case are presented in Table 1 above. The barrier has the least effect on maximum velocity for the South wind. The maximum velocity reduced by 2% with the addition of a barrier for Option A. The barrier had the greatest effect on velocity for the full pile case with a West or Southwest wind. The maximum velocity was reduced by 17% for both the West and Southwest winds.
Option B
For Option B, four different wind directions were analyzed and simulated with and without a barrier for a wind speed of 7.5 m/s.
| Wind Direction | Max Velocity w/o Barrier (m/s) | Max Velocity w/Barrier (m/s) | Max Velocity Reduction |
| West | 15.97 | 11.36 | 29% |
| Southwest | 15.14 | 9.21 | 39% |
| South | 13.4 | 10.1 | 24% |
| East | 12.78 | 7.15 | 44% |
Conclusion
The model results clearly showed that the addition of a barrier around the stockpiles would help reduce the velocities and prevent fugitive dust emissions. Though there is a cost associated with adding the barrier along the site, this option will help achieve the environmental norms by reducing dust emissions. It is evident from the model results that FLOW-3D can be used as an accurate and reliable tool for studying fugitive dust emissions. If further design changes and new options for iron-ore layouts are proposed, they can be easily modeled in FLOW-3D to determine the optimum configuration which is both cost and environmentally effective.
