Wave Forces on Coastal Bridges
This article was contributed by Jun Jin, Assistant Professor in the Maritime Systems Engineering Department at Texas A&M University at Galveston.
In recent years, hurricanes have caused structural damages to several coastal highway bridges in all four states along the US coast of the Gulf of Mexico. To prevent future hurricane damage to coastal bridges, the magnitude of wave loads on bridge superstructures must be determined with reasonable accuracy. In general, the computation of wave loads on structures is complicated by the complex nature of wave-structure interaction. This note illustrates how many of these complications can be addressed.
Validation of Stokes Nonlinear Wave Solution in FLOW-3D
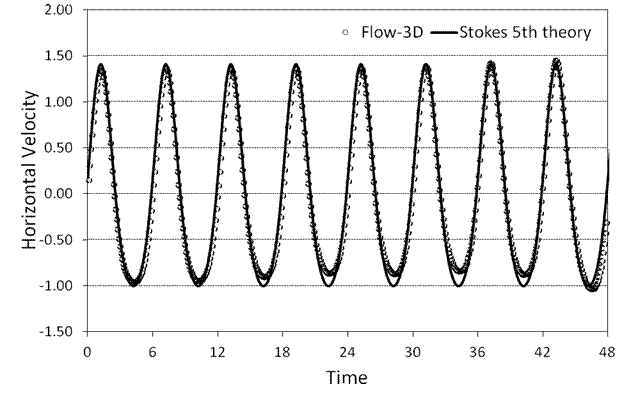
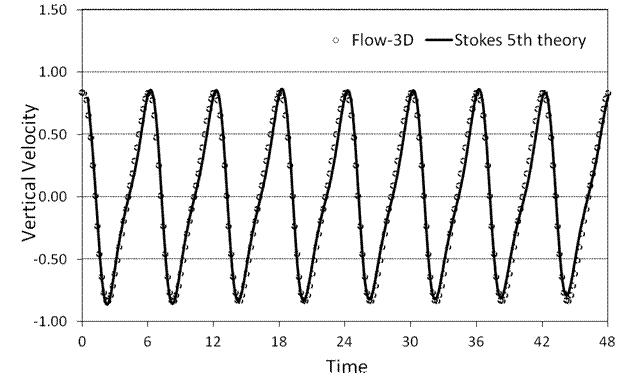
FLOW-3D was chosen to compute wave loads on coastal bridges and investigate the effects of structure elevation and green water (water on deck) loading. A fifth-order Stokes wave was used as a boundary condition. To evaluate the accuracy of the Stokes wave solution in FLOW-3D, three points in the computational domain were selected as particle sources (Figure 1). During the simulation, each particle source released 10 particles per second. The particle trajectories were plotted in Figure 1. Water particle velocities of one point were compared to theoretical results (Figure 2a and 2b). It was concluded that water particle kinematics computed by FLOW-3D agrees well with the Stokes nonlinear wave theory.
Wave Loads vs. Superstructure Elevations
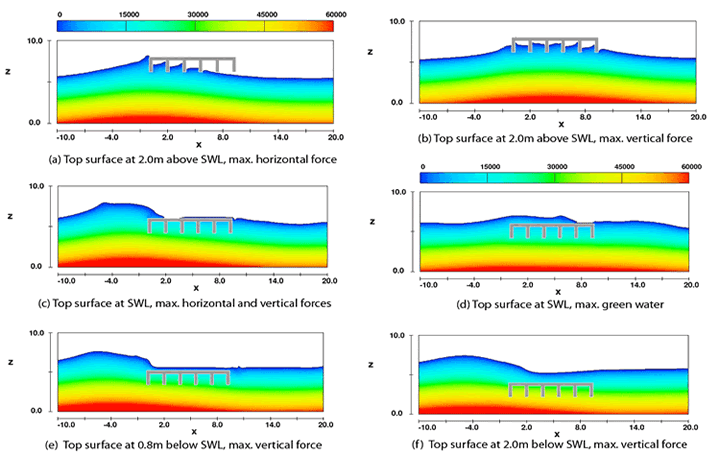
The bridge deck was then set at different elevations and simulations were run with a Stokes fifth-order wave of 2m wave height and 6s period. Figure 3 shows wave profile and pressure contours when wave forces are at their maxima.
Flow Field under Bridge Deck
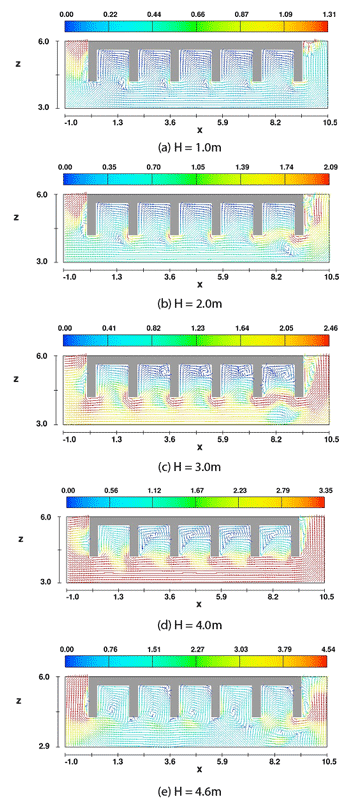
Simulations were also run with different wave heights. As shown in Figure 4, the flow fields under the bridge deck are complicated. Within the open chambers formed by girders and superstructures, water flow was along the boundaries in a circular pattern. It was also observed that flow complexity increased with increasing wave height.
Observations
The following conclusions can be drawn from the simulation results:
- Vertical wave forces on bridge superstructures decrease with increasing superstructure elevation, while horizontal wave forces are are not significantly affected when the top surface of the bridge superstructure is below a wave crest.
- Green water loading on a bridge superstructure increases with wave height. For near breaking waves, maximum green water loading exceeded 50% of the maximum vertical wave force. However, due to the phase differences between green water loading and upward wave forces, the maximum value of the vertical wave force was not significantly reduced by green water loading.
- Flow field around bridge superstructures is interrupted by parallel girders; therefore, methods based purely on wave kinematics cannot be used to compute wave forces.


