
Optimizing Design Performance with Baffle Placement
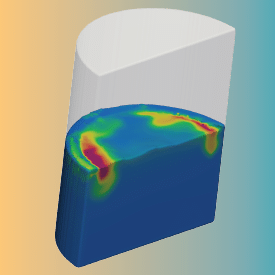
Optimizing design performance with baffles in order to dampen sloshing in liquid storage tanks was the optimization goal of this FLOW-3D (x) case study.
Characterizing Contact Tank Performance
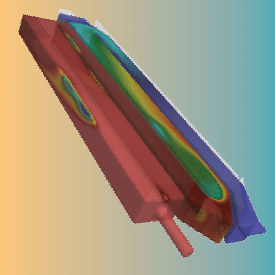
In this FLOW-3D(x) case study, the performance goal is to characterize the performance of a chlorine disinfecting contact tank in an activated sludge process with varying bacteria loads.
Calibrating Simulation Parameters
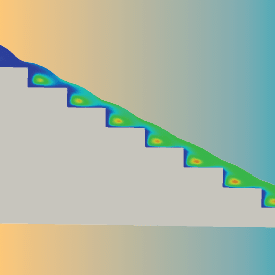
The goal of this FLOW-3D(x) calibration study was to investigate the impact of various numerical parameters on the simulation of air entrainment on a stepped spillway.
Optimization of a Tilt Pour Casting
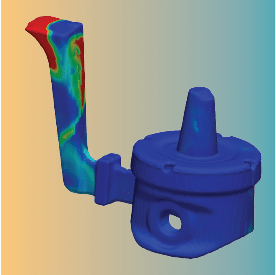
In this FLOW-3D(x) case study, the optimization goal is to optimize a tilt pour casting of a combustion engine piston to minimize air entrainment.
