Modular Permeable Pavements
Modular permeable pavements are alternatives to traditional impervious asphalt and concrete pavements. Because of their ability to allow water to quickly infiltrate through the surface, modular permeable pavements allow for reductions in runoff quantity and peak runoff rates. Modular permeable pavements are considered an effective tool in helping with stormwater control. This study will focus on modelling and visualizing changes in permeable pavements using FLOW-3D to validate laboratory and on-site experimental results. Our civil and environmental customers now use FLOW-3D HYDRO for these types of modeling and analysis.
Experimental Setup
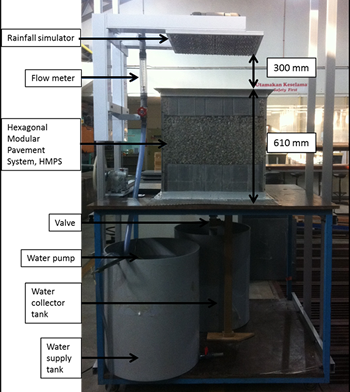
The designed permeable pavement was constructed in 525mm x 565mm Perspex with hexagonal modular pavement that was set up with a hole on the bottom plate for water to pass through. Plate 1.1 shows the overall infiltration rig together with the designed permeable pavement to be tested. A rainfall simulator with 800 evenly spaced 50mm center to center sprays was set up above the pavement surface to cover an area of 525mm x 565mm. Varied conditions of simulated rainfall intensities were controlled by a flow meter. The water flowing through the pavement was collected from underneath the pavement via a funnel connected only to the central 500mm x 500mm area. The infiltration area was limited to 500mm x 500mm to prevent boundary effects influencing the hydraulic flow within the PVC box. The flat surface at the top of the funnel was screwed on to the bottom plate. There is one infiltrated hole in the middle of the bottom wooden plate (525mm x 565mm). The diameter of the hole is 12 mm and is connected with a controlled valve. This valve is used to model different conditions in the sub base that vary from fully saturated to highly permeable areas. In the boundary, 25 drainage holes were drilled on each side of the bottom plate. The pavement is constructed at a zero slope. There are two PVC tanks at the bottom of the rig: one is the water inlet storage that supplies the rainfall simulator and the other collects the outflow water. Both of the tanks are connected with a pipe and the amount of water can be controlled by calibrating the valves. This research was supported by E-Science Fund; titled Development of Modular Infiltration within Permeable Pavements for Urban Stormwater Management from the Ministry of Science, Technology and Innovation, Malaysia; under Project No:(03-01-05-SF0502).
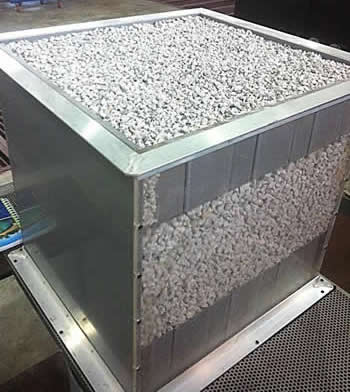
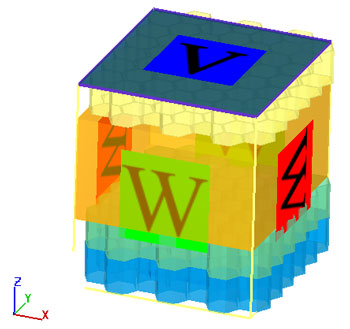
The physical model of the permeable pavement was placed in a vertical rectangular flume as shown in Plate 1.2 made from 20mm thickness PVC for three sides and 20mm thickness of Perspex for front view of the model having a width of 525mm and length of 565mm. In this permeable pavement, as shown in Figure 1.1, there are three different layers: 110mm thickness of surface layer, 300mm thickness of gravel base and 200mm thickness of sub-base layer. The sub-base layer was constructed by adding two layers of HMPS to the rig to 200mm depth. After completion of the sub-base layer, the gravel-base layer was constructed by adding washed clean cubical aggregate of size 15mm to 20mm to the infiltration rig. The surface layer of HMPS consists of hexagonal columns of PVC with 5mm clean cubical aggregate.
Model Verification
The model was verified by comparing laboratory data against simulation data for water flow rates of 20L/m, 15L/m, 10L/m, and 5L/m. The data consist of the height of fluid accumulation at the bottom of the pavement layer as a function of time. These data were chosen due to their short runtimes in FLOW-3D HYDRO. Figure 1.2 shows a comparison between observed and computed results during an experiment with 20L/m. The difference between observed and computed time was very small, about 5 sec. This confirmed that the computational model of hexagonal modular pavement system, HMPS, and all the data used for running this FLOW-3D HYDRO simulation were in agreement with the laboratory conditions. Comparisons between observed and computed data for 15L/m are shown in Figure 1.3. The graph shows the same trend line and difference of about 5 sec as well. While Figure 1.4 shows graph of comparison between computed and observed data for 10L/m. This case shows total agreement except for about 5 sec more for simulated versus observed data. Simulated and observed data were plotted in Figure 1.5 for the 5L/m case where the differences were less than 5 sec.
The Effect of Layer Thickness
Surface water runoff from impervious pavements occurs in the following manner: falling rain first wets the surface and, as the rainfall increases, water begins to pond in surface depressions until these have filled; the surface water then moves towards drainage points or discharges into water courses. This moving water becomes the surface water runoff, whilst the water remaining in puddles will eventually be absorbed or will evaporate. The amount of time taken for the water to move from the farthest point where rain hits the ground to entering the drainage system is known as the ‘time of entry’. In the case of traditional impermeable surfaces the distance from the farthest point to an outlet may be some 20 to 30m. In contrast, with Hexagonal Modular Pavement System, HMPS, the time of entry is only the time that it takes the droplet of rain to hit the surface area and move to the gap between adjacent (gravel) particles. Effects of the permeable pavement surface thickness in Figure 1.6 were simulated in FLOW-3D HYDRO.
For each case simulated, velocity fields are similar, however, differences can be observed in the way that the FAVOR™ method interprets the geometry. When the mesh is too coarse to resolve the walls of the PVC hexagonal columns there can be fluid leakage between the inside and outside of the walls. Results show that pressures in Figure 1.9 are in reasonably good agreement with one another, with marked differences between the solution of the coarsest mesh and the mesh independent solutions of the two other meshes. In particular, differences at the water surface and at the bed are caused by the mesh approximating the location of the geometry and water surface, which results in differences in interpolation between the non-zero velocity of cells in the flow field and the zero velocity of adjacent cells either within the obstacle or above water surface as in Figures 1.10, 1.11 and 1.12. The discrepancies should be minimized by using a finer mesh.
Conclusion
It may be concluded, from the range of tests that were conducted, that FLOW-3D HYDRO adequately models flows of modular pavements, HMPS. Results also indicate that complex 2D flow is always adequately modeled, particularly when comparing water surface profiles to those of the physical model. This complies with the third objective of this study, to compare the experimental and model results under the same operating situations. Furthermore, simulations can be run with alternative porous media models or with scaled or prototype dimensions. This study has shown that FLOW-3D HYDRO is sufficiently advanced so as to model the general characteristics of the flow through the pavement structures. A more powerful computer is necessary for more detailed studies. These findings are valid for this particular case, and should be used as a guide when studying other designs.
Finally, from this research, one can see that the pavement structure works as an integrated hydraulic system. The performance of this system is related to all of the components within the system. The next step of this research is to develop a simplified model based on the analysis method presented in this research. To improve the estimation of the material properties used in the computational fluid dynamics model, more laboratory tests should be conducted for the soil water characteristic curves.


