Aerial Landslide Generated Wave Simulations
Experimental Setup
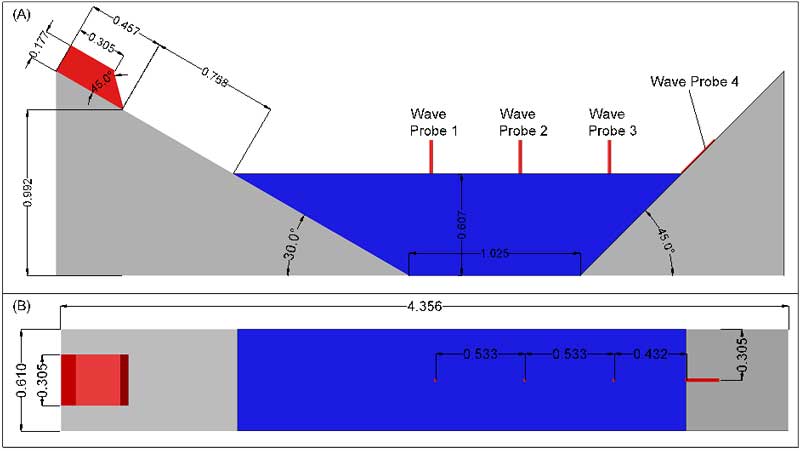
The physical experiment was constructed and tested in Northwest Hydraulic Consultants North Vancouver, Canada laboratory. It consisted of a 0.610-m wide flume with a 30-deg sloped West wall, a 45-deg slopped East wall, two vertical walls on the North and South sides of the model, and a 1.025-m horizontal section connecting the toe of both the East and West slopes. To generate and evaluate ALGWs, a six second test with a 0.177×0.305×0.305-m weighted acrylic box with a 45-deg sloped nose was used (Figure 1). When released, the slide traveled (by gravity) 0.768-m down the West slope before impacting the 0.607-m deep water; after which, it traveled another 1.05-m, through the water, before hitting a stop block. Slide acceleration and displacement, as well as, wave heights were recorded at a frequency of 100Hz for the entire six-second experiment. The instruments used to capture this data were as follows:- computerized data acquisition system
- string potentiometer to measure the distance traveled over time of the slide
- one-dimensional accelerometer to measure slide acceleration
- three one-dimensional capacitance wave-probes placed within main body of water
- resistance ladder wave probe used along the East slope to capture wave run-up
- timing switch used capture slide release time
- black and white video cameras
Numerical Model Setup
A computerized three-dimensional model of the physical experiment was constructed and imported into FLOW-3D as a sterolithography file. Once in FLOW-3D, the 3D-model was discretized into about 13.7 million 0.0075-m sized square cells, and ‘wall’ boundaries were used for each of the six faces enveloping the domain.
The slide was set as a general moving object, and a prescribed velocity was given based on data collected from the physical model (i.e. post processing of acceleration and displacement data). Surface roughness for the East and West sloped faces was set to 0.00025-m. The modeled fluid was water at 293k, and a dynamic RNG turbulence model with a second-order momentum advection scheme was used with the default settings (implicit pressure solve; and, explicit viscous stress, free surface pressure, advection, moving object/fluid coupling solvers).
Similar to the physical model, FLOW-3D simulated a period of six seconds[1], but only saved data every 0.02 seconds instead of every 0.01 seconds like the physical model (this was chosen purely from a data management point of view).
Results
The results of both the physical and FLOW-3D experiments are presented in Figure 2. It shows scalar wave heights over the duration of the experiment for each of the four wave probes. As such, the presented wave heights are not simply a representation of waves propagating through the flume (i.e., what you would see in a two-dimensional case), but rather they are resulting wave heights caused by interactions from several wave signals:
- Impulse wave generated upon slide impact (Primary signal)
- Post impact wave collisions behind the slide (Secondary signal–Figure 3 at 1sec)
- Wave reflection from the North, East, West, & South walls (Tertiary signal)
In addition, longitudinal FLOW-3D data (at the centerline) was overlaid onto the physical model video to evaluate FLOW-3D global predictions of the water’s free surface. This can be seen in the video below – specifically panel (a).
From Figure 2 and the video above, it can be seen that the FLOW-3D data matches the physical data exceptionally well for wave probes 1, 2, & 3. But appears to be less accurate for wave probe 4 and seems to over predict the maximum wave run-up.
The error associated between the physical and FLOW-3D temporal data is evaluated by taking the root-mean-square-error (RMSE) for each wave probe. These values are presented on each panel of Figure 2.
Discussion
In this investigation, high fidelity data from a physical model was compared against FLOW-3Dpredictions on the maximum wave run-up caused by aerial landslide generated waves. Using a second-order momentum advection scheme and the default setting, FLOW-3D was able to accurately reproduce the scalar wave heights within the main body of water. However, the maximum wave run-up was over predicted by approximately 43%.
Several alternative FLOW-3D physics packages/settings were used to help reduce the maximum wave run-up. However, it was not possible to get below an error of 43%. The notable observations of these alternative simulations are as follows:
- A 0.01-m mesh with a first-order momentum advection scheme yielded a maximum wave run-up error of 96%, while the error for a 0.0075-m mesh with the same first-order momentum advection scheme was 130%. However, changing the momentum advection scheme to second-order yields errors of 55% and 43% for the 0.01-m and 0.0075-m meshes, respectively. Furthermore, decreasing the mesh cell size to 0.005-m with a second-order momentum advection scheme yields an error of 80%.
- The most significant parameter for this test case is the order of the momentum advection scheme. On average, using a second-order scheme versus a first-order one reduced the error by about 50%.
- Using a mesh cell size of 0.005-m required using the MP version of FLOW-3D. During which the CPU time was 33 hours. For comparison, the standard version of FLOW-3D required 26 CPU hours to run the simulation with a mesh cell size of 0.0075-m, while the MP version only took 4.5 CPU hours.
[1] Six seconds of physical time took approximate 26 hours of CPU time on a 3.5GHz 8-Core AMD FX-8320 processor.
References
Fritz, H. M., Hager, W. H., & Minor, H.-E. (2004). Near Field Characteristics of Landslide Generated Impulse Waves. Journal of Waterway, Port, Coastal & Ocean Engineering, 130(6), 287–302. doi:10.1061/(ASCE)0733-950X(2004)130:6(287)
Miller, D. J. (1960). Giant Waves in Lituya Bay Alaska (Geological Survey Professional Paper No. 354-C). Washington, D.C.: United States Government Printing Office.
Müller-Salzburg, L. (1987). The Vajont catastrophe— A personal review. Engineering Geology, 24(1–4), 423–444. doi:10.1016/0013-7952(87)90078-0


